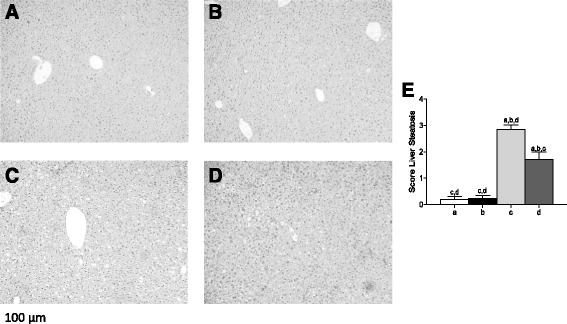
Fig. 1.

Liver histology in control and high-fat diet (HFD) fed mice receiving hydroxytyrosol (HT) supplementation. Representative liver sections are from a CD diet, b CD + HT, c HFD, d HFD + HT (haematoxylin-eosin liver sections from of 8–10 animals per experimental group; original magnification x10) and (e) Score Liver Steatosis. Significant differences between the groups are indicated by the letter identifying each group (one-way ANOVA and Newman-Keuls´ post-test; p < 0.05)
