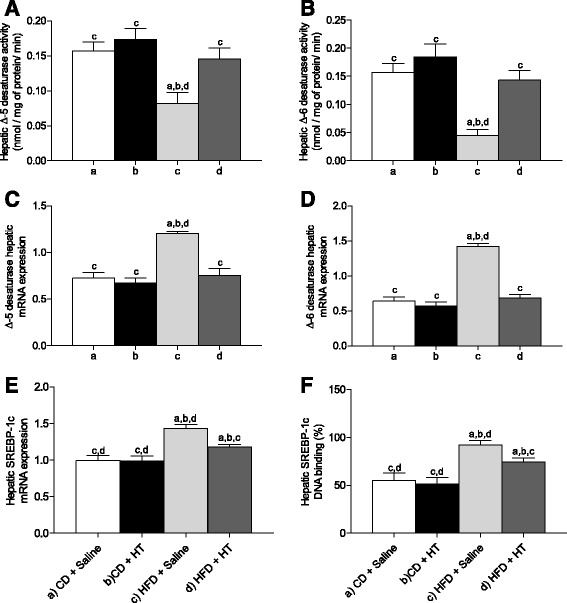
Fig. 2.

Liver desaturase activities and expression and liver SREBP-1c expression and DNA-binding activity from control mice and high fat diet (HFD) fed mice receiving hydroxytyrosol (HT) supplementation. a Δ-5 desaturase activity; b, Δ-6 desaturase activity; c, Δ-5 desaturase mRNA expression; d, Δ-6 desaturase mRNA expression; e, SREBP-1c mRNA expression; and f, SREBP-1c DNA binding activity. Values represent means ± SEM for 12–14 mice per experimental group. Significant differences between the groups are indicated by the letter identifying each group (one-way ANOVA and Newman-Keuls´ post-test; p < 0.05)
