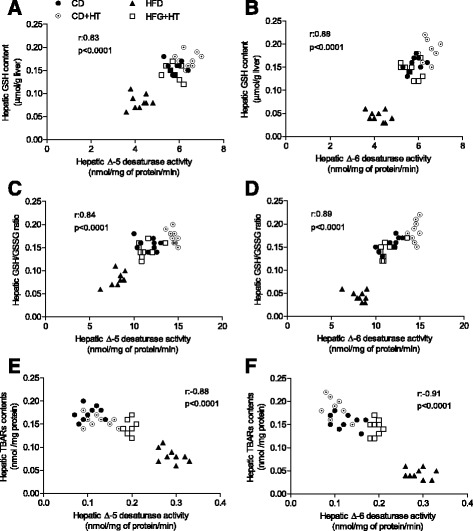
Fig. 4.

Correlation of ∆-5 and ∆-6 desaturase activities with oxidative stress-related parameters in the liver of control mice and high-fat diet (HFD) fed mice receiving hydroxytyrosol (HT) supplementation. a GSH content v/s ∆-5 desaturase activity; b, GSH content v/s ∆-6 desaturase activity; c, GSH/GSSG ratio v/s ∆-5 desaturase activity; d, GSH/GSSG ratio v/s ∆-6 desaturase activity; e, TBARs content v/s ∆-5 desaturase activity; and f, TBARs content v/s ∆-6 desaturase activity
