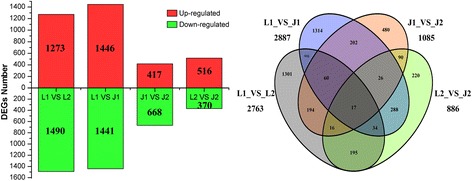
Fig. 5.

DEGs statistics and Venn diagrams between different cDNA libraries. Red color indicates up–regulated expression of DEGs; Green color indicates down–regulated expression of DEGs. L1 and J1: the DEGs were generated from LE relative to JG cultivar at 15 DAFB; L2 and J2: the DEGs of LE relative to JG cultivar at 21 DAFB. JG was always control sample
