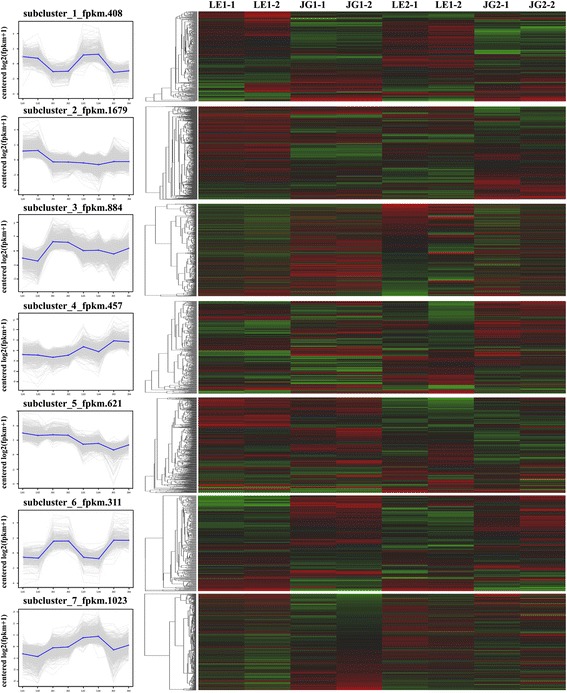
Fig. 7.

Common expression analysis based on DEGs expression patterns. Left: Numbers under the x-axis indicated different sample, numbers under the y-axis indicated the log2(fpkm + 1). Right: Red color represents higher log2(fpkm + 1) data of genes; Green color represents lower log2(fpkm + 1) data of genes. Black color represents log2(fpkm + 1) = 0. LE1–1 and LE1–2 indicate two biological replications of LE at 15 DAFB; LE2–1 and LE2–2 indicate two biological replications of LE at 21 DAFB; JG1–1 and JG1–2 indicate two biological replications of JG at 15 DAFB; JG2–1 and JG2–2 indicate biological replications of JG at 21 DAFB
