
Fig. 3.
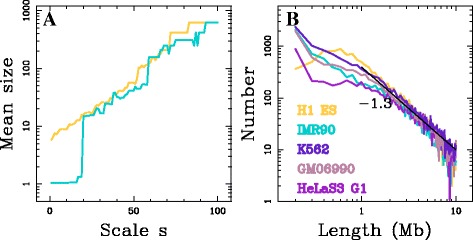
Multi-scale communities in the DNA interaction network. a Mean structural community size (in 100 kb pixels) for chromosome 12 as a function of the scale index in IMR90 (blue) and H1 ES (yellow). b Histogram of interval-communities genomic length (l) calculated in 100 kb bins in a log-log representation for different cell lines: IMR90 (blue), H1 ES (yellow), GM06990 (pink), K562 (purple) and HeLa (G1) (light purple). The black straight line correspond to the power-law behaviour l α with α=−1.3