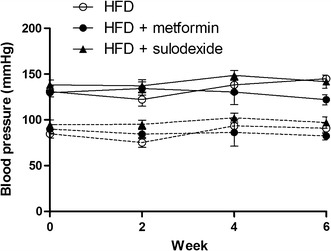
Fig. 1.

Systolic and diastolic blood pressure of the HFD group and intervention groups. Systolic (solid lines) and diastolic (dashed lines) blood pressure of the HFD group (n = 8; open circles) and intervention groups (n = 8; filled circles and n = 8; triangle). Statistically significant differences between groups were not observed
