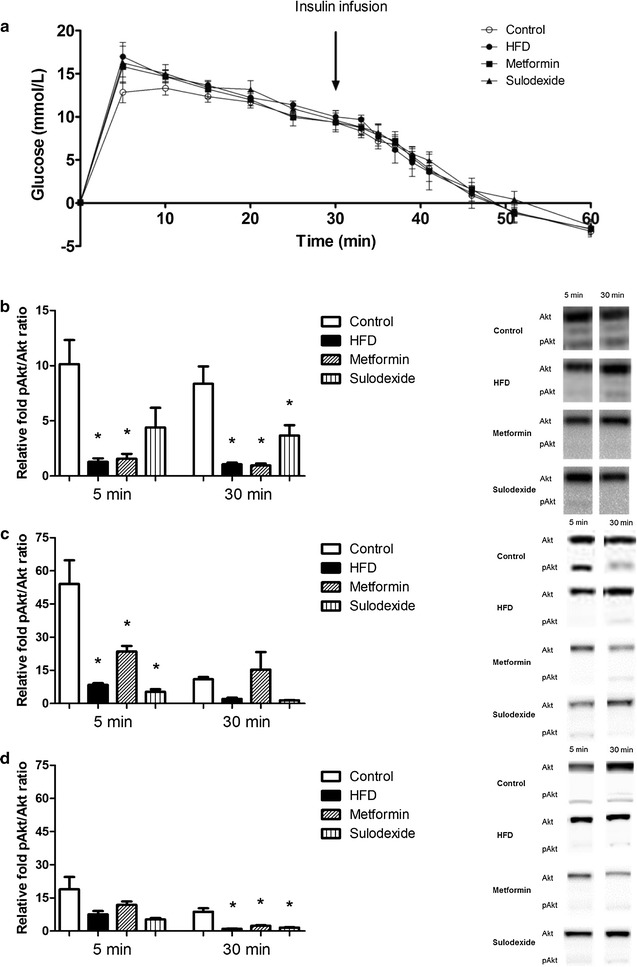
Fig. 2.

Intravenous insulin tolerance test (IVITT) in control, HFD, and metformin- and sulodexide-treated rats. a Glucose level was corrected for baseline glucose level and time indicates the time after glucose infusion. No differences in glucose level were observed between control rats (n = 9) HFD rats (n = 9), HFD rats that received metformin (n = 9) and HFD rats treated with sulodexide (n = 6). Ventricular tissues (b), gastrocnemius muscle (c) and soleus muscle (d) were isolated at t = 5 and t = 30 min (n = 3 per time point) after the insulin injection. For all isolated tissues, representative Western Blots are shown. Data are expressed as mean ± SEM, *p < 0.05 vs. control group. #p < 0.05 vs. HFD group
