Fig. 4.

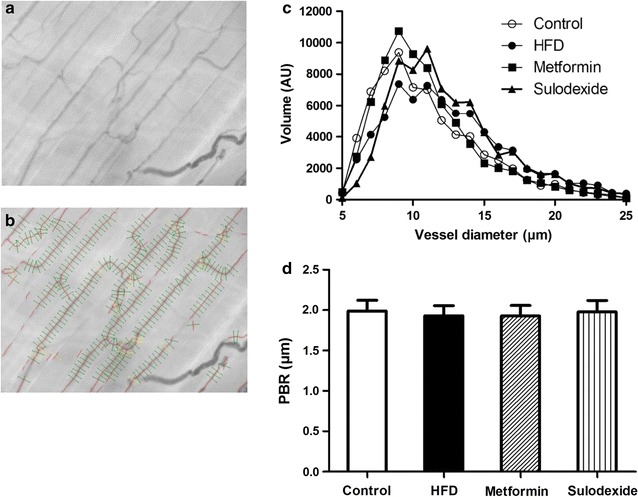
Imaging of the gastrocnemius muscle microcirculation to measure glycocalyx barrier properties. a Example of a single SDF image of rat gastrocnemius microcirculation. b In each microvessel that fitted the criteria of analysis (a) in focus, b had a sufficient length and were not close to bifurcation, and c were continuously filled with RBCs and did not contain plasma gaps) lines were placed ± every 10 µm perpendicular to the vessel direction (as shown by lines in image). c Microvascular volume was determined for all vessel diameters (5–25 µm) for control rats (n = 5), HFD rats (n = 8), metformin-treated rats (n = 8) and sulodexide-treated rats (n = 8) and are not significantly different (p = 0.918 and p = 0.812, respectively). d No significant differences are found between the PBR of control rats (1.99 ± 0.13 µm), HFD rats (1.93 ± 0.12 µm), metformin-treated rats (1.93 ± 0.13 µm) and sulodexide-treated rats (1.98 ± 0.14 µm). Data are expressed as mean ± SEM, *p < 0.05 vs. control group, #p < 0.05 vs. HFD group
