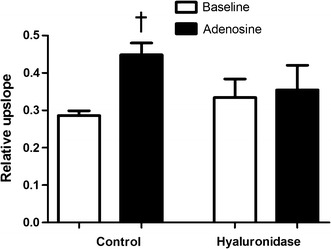
Fig. 5.

Myocardial perfusion measurements with first-pass perfusion MR imaging. Semi-quantitative myocardial perfusion values (relative upslope) in LV myocardium of control rats (n = 5) and hyaluronidase treated rats (n = 6) are presented during baseline conditions and adenosine infusion. Data are expressed as mean ± SEM. *p < 0.05 vs. control group, †p < 0.05 adenosine effect
