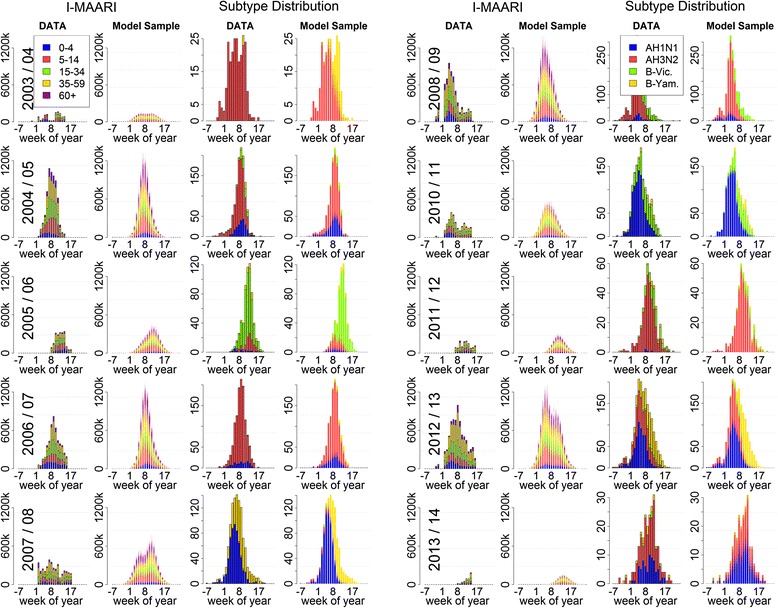
Fig. 1.

Seasonal influenza data and output from the fitted transmission model. Influenza epidemics according to data and fitted model for the seasons 2003/04 till 2013/14 excluding the pandemic season 2009/10. The first and second column show the I-MAARI estimated by AGI and NIC virological data, respectively. The third and fourth column provide corresponding model-predicted consultation numbers and subtype distribution based on overlaid output subject to 1000 parameter vectors drawn from the posterior distribution
