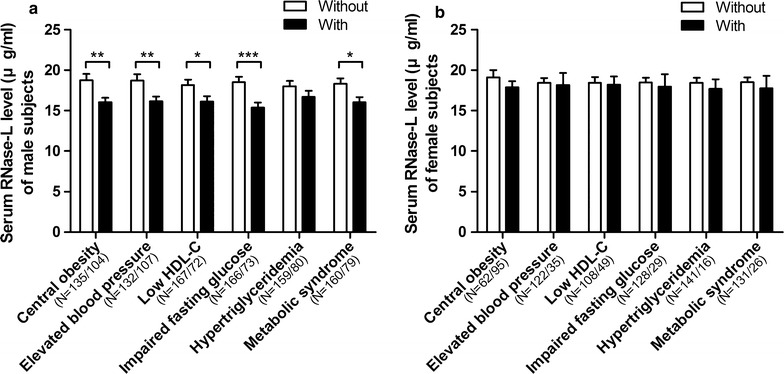
Fig. 2.

Gender-dependent comparisons of serum RNase-L levels between the subjects with and without MetS components. The differences of RNase-L levels between the (a) male or (b) female subjects with and without the components were respectively shown with black and white bars. The data were shown as mean and SE. *P < 0.05, **P < 0.01, ***P < 0.001
