Figure 5.

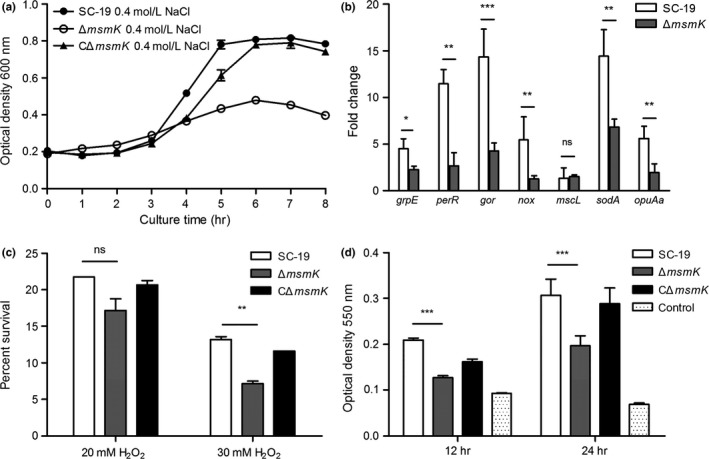
In vitro stress assays. (a) Osmotic stress assay. Growth curves were monitored at an initial OD 600 of 0.2. SS2 strains were grown at 400 mmol/L NaCl. Data points are the mean ± SEM from three independent experiments performed in triplicate. (b) Gene expression analysis of osmosis‐related genes of SC‐19 and ΔmsmK in the presence of 400 mmol/L NaCl compared with the absence of NaCl. The results represent the mean ± SEM. ns, p > 0.05; *, p ≤ 0.05; **, p ≤ 0.01; ***, p ≤ 0.001. (c) Oxidative stress assay. Bacteria were incubated at 37°C for 20 min with or without 20 mmol/L or 30 mmol/L H2O2. Data are presented as mean survival rate ± SEM. ns, p > 0.05; **, p ≤ 0.01. (d) Biofilm formation by SS2 strains. Strains were incubated in 96‐well microplates for 12 and 24 hr at 37°C. The wells with a sterile medium served as negative controls. Data are expressed as mean ± SEM. ***, p ≤ 0.001
