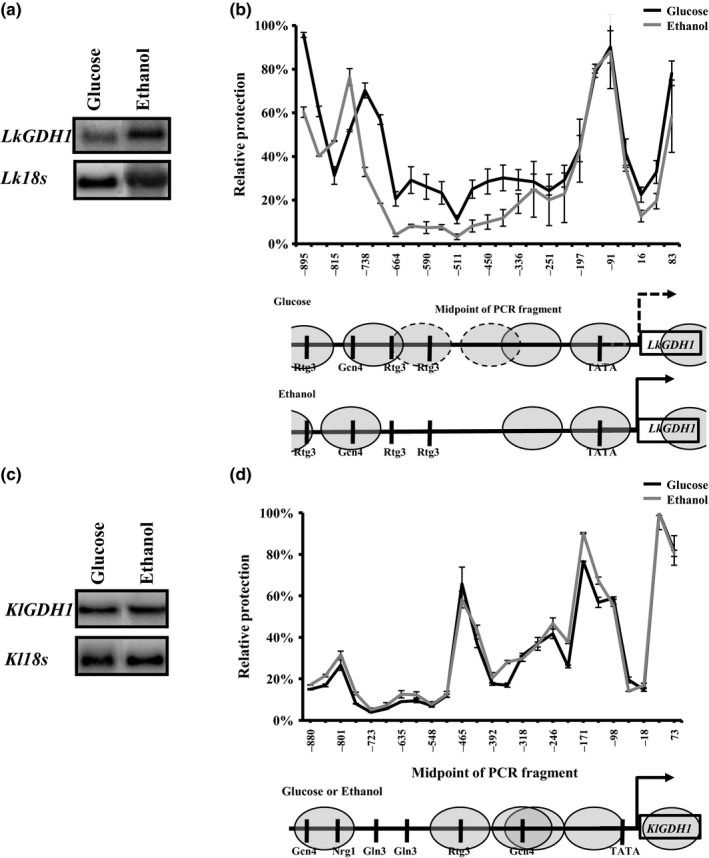
Figure 2.

LkGDH1 and KlGDH1 NuSA and expression profile. (a) Northern blot analysis shown expression profile of LkGDH1 gene and (c) Northern blot analysis shown expression profile KlGDH3 gene, in both cases Lk18s or Kl18s ribosomal gene was used as control in glucose or ethanol as carbon source. (b) Nucleosome scanning assay (NuSA) LkGDH1 gene promoter in glucose (black line) or ethanol (gray line); and (d) Nucleosome Scanning Assay (NuSA) KlGDH1 gene promoter in glucose (black line) or ethanol (gray line); nucleosomes are shown in gray ovals and black vertical lines shown DNA binding sites. Error bars represent the standard deviations
