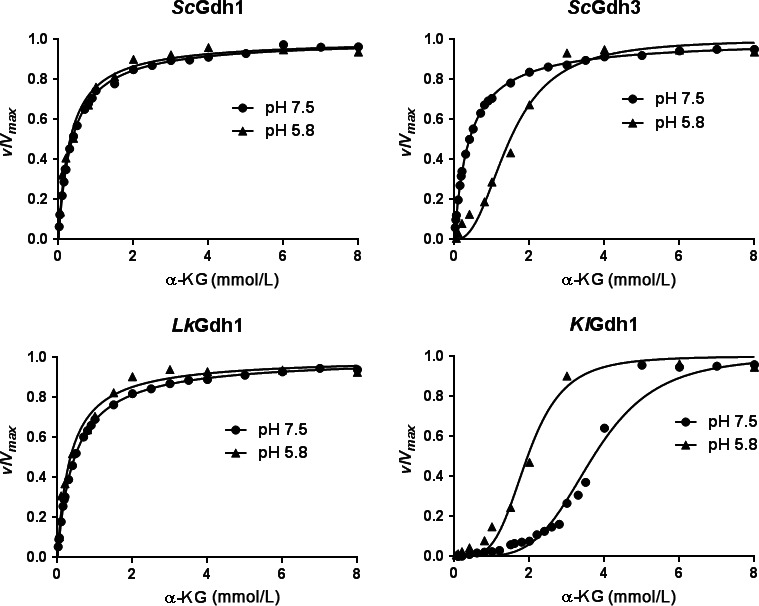
Figure 5.

Effect of pH on the NADP‐GDH kinetic responses to α‐KG saturation. Initial velocities are shown as fractions of the corresponding V max at different α‐KG concentrations. The reductive amination reaction was measured in pure recombinant proteins from S. cerevisiae (ScGdh1 and ScGdh3), L. kluyveri (LkGdh1), and K. lactis (KlGdh1). The corresponding kinetic parameters are shown in Table 3
