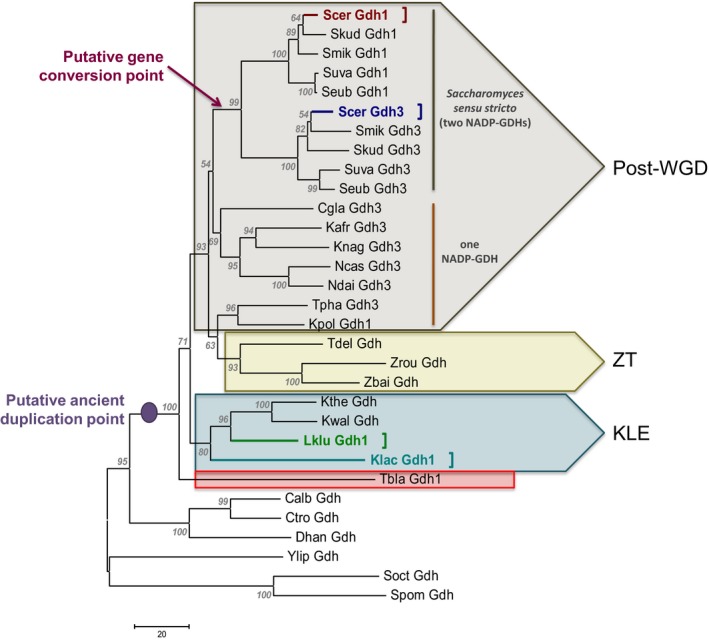
Figure 6.

Evolutionary relationships of NADP‐GDHs from yeasts. The phylogeny was constructed using the neighbor‐joining method (Saitou & Nei, 1987). The optimal tree with the sum of branch length = 1043.39892578 is shown. The percentage of replicate trees in which the associated taxa clustered together in the bootstrap test (500 replicates) are shown next to the branches (Felsenstein, 1985). The tree is drawn to scale, with branch lengths in the same units as those of the evolutionary distances used to infer the phylogenetic tree. The evolutionary distances were computed using the number of differences method (Nei & Kumar, 2000) and are in the units of the number of amino acid differences per sequence. The analysis involved 31 amino acid sequences. All ambiguous positions were removed for each sequence pair. There were a total of 484 positions in the final dataset. Evolutionary analyses were conducted in MEGA6 (Tamura et al., 2013). Scer Gdh1, Saccharomyces cerevisiae ScGdh1 (red letters and square bracket); Scer Gdh3, Saccharomyces cerevisiae ScGdh3 (dark blue letters and square bracket); Lklu Gdh1, Lachancea kluyveri LkGdh1 (green letters and square bracket); Klac Gdh1, Kluyveromyces lactis KlGdh1 (light blue letters and square bracket). Post‐WGD, post‐whole genome duplicacion clade (light brown group); ZT, Zygosaccharomyces‐Torulaspora clade (light yellow group); KLE, Kluyveromyces‐Lachancea‐Eremothecium clade (light blue group). Tbla Gdh1, Torulaspora blattae Gdh1 (red square). NADP‐GDH sequence accession numbers, taxa used and their corresponding abbreviations are included in Table S2
