Figure 5.

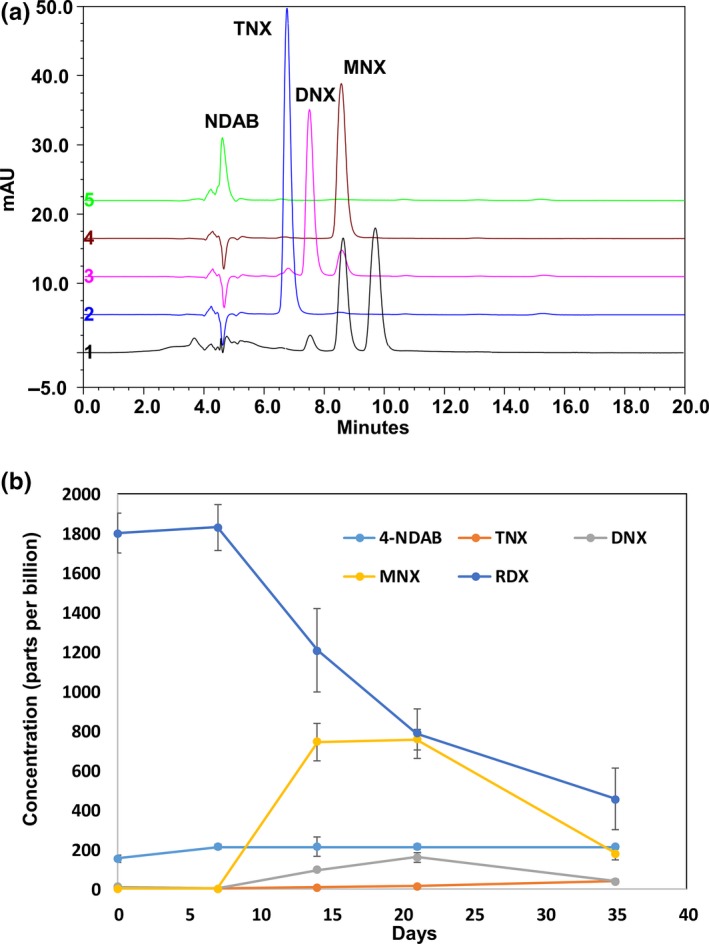
(a) HPLC chromatograms showing RDX degradation and production of RDX derivatives. 1. CDV‐16‐4ip with 2 ppm RDX was amended with 1% (v/v) safflower oil. The sample was incubated at anaerobic condition for 3 weeks. Samples were filtered to remove bacteria and other particles before HPLC analysis. 2. TNX standard. 3. DNX standard. 4. MNX standard. 5. NDAB standard. (b) Kinetics of RDX degradation and production of its derivatives. CdV‐16‐4ip (RDX ~ 2 ppm) was amended with 1% (v/v) safflower oil. The concentration of RDX, MNX, DNX, TNX, and NDAB was monitored up to 5 weeks
