
Figure 2.
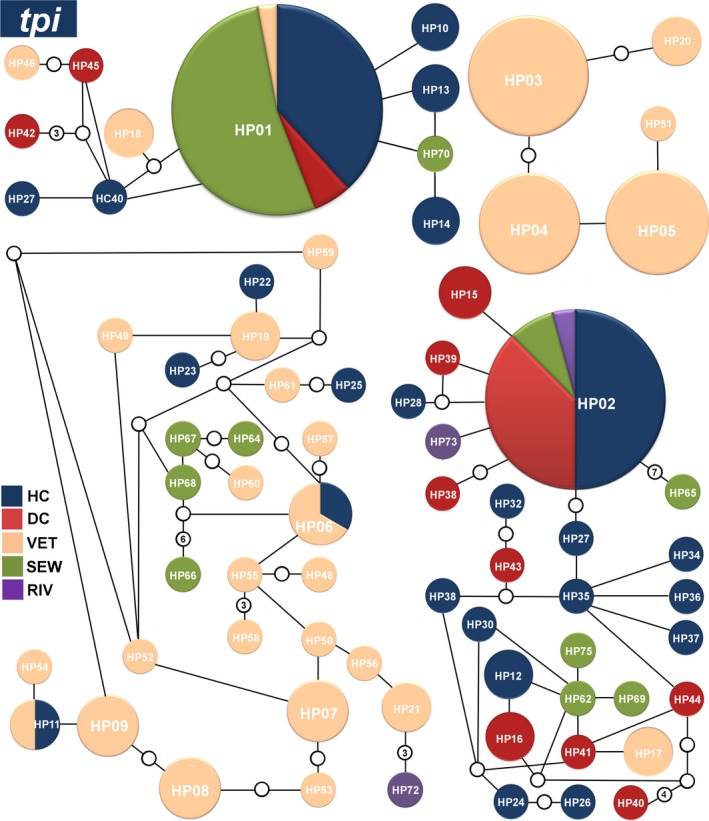
Networks of the main haplotypes of Giardia duodenalis at the tpi locus. Relative frequencies of the main haplotypes and their connections for the hospital clinical (dark blue), daycare center (red), veterinary (orange), sewage (green), and river (purple) sequences generated from a statistical parsimony network. The lines connecting each haplotype represent one mutation, and small white circles represent inferred haplotypes that were not actually observed. Haplotypes that are not connected to others exhibited more steps (or mutations) than the connection limit (95% confidence). The sizes of the circles are proportional to the haplotype frequency