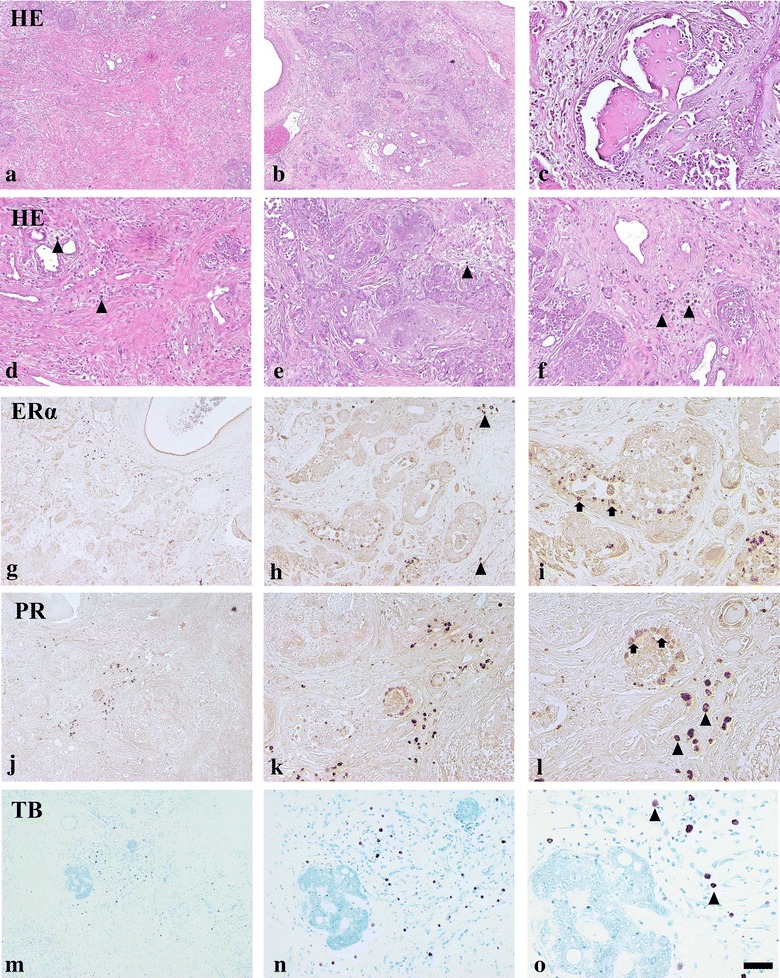
Fig. 1.

Low and high magnification photos of various regions of the mammary tumor, HE. Desmoplasia (a, d), chondroid components (b, e), osseous tissues adjacent duts (c) and diffused mast cells (arrowheads) in stroma (f). Immunohistochemistry of ERα (g–i) and PR (j–l) in the tumor. Toluidine blue (TB) staining for mast cells (n–o). Arrows indicate epithelial cells. Scale bars 250 µm (a, b, g, j, m), 100 µm (c–f, h, k, n) and 50 µm (i, l, p)
