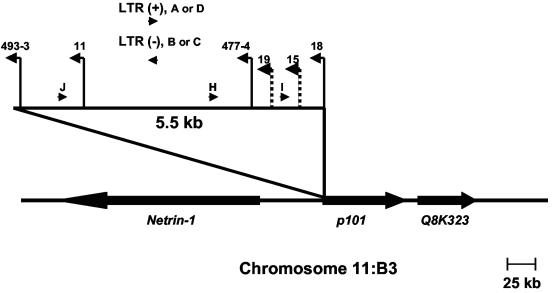
FIG. 7.
Physical map of the 3-19 locus. Depicted is the 5.5-kb domain of common proviral insertion. Vertical lines represent the positions of proviral integrations (indicated by animal number) with the transcriptional orientation of each provirus depicted by the direction of the arrow. Solid lines represent insertions detectable by Southern blot analysis. Checkered lines represent insertions undetectable by Southern blot analysis but identified by PCR amplification. Oligonucleotide primers used in PCR to amplify host-virus junctions are illustrated as horizontal arrowheads. The positions and transcriptional directions of the Netrin-1, p101, and Q8K323 genes are indicated.

