
Figure 8.
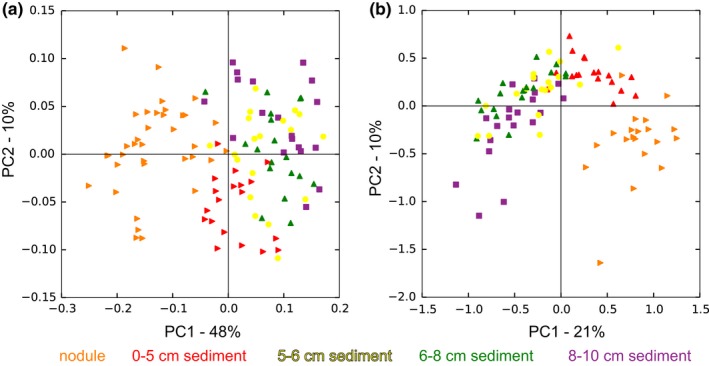
Principal Component Analysis (PCoA) plots based on weighted UniFrac distance measurements comparing: (a) prokaryotic communities; (b) eukaryotic communities associated with different layers of sediment and nodules in the study area
Official websites use .gov
A
.gov website belongs to an official
government organization in the United States.
Secure .gov websites use HTTPS
A lock (
) or https:// means you've safely
connected to the .gov website. Share sensitive
information only on official, secure websites.
Principal Component Analysis (PCoA) plots based on weighted UniFrac distance measurements comparing: (a) prokaryotic communities; (b) eukaryotic communities associated with different layers of sediment and nodules in the study area