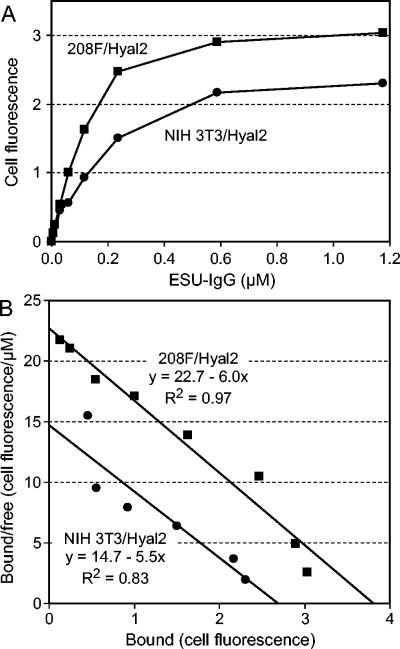
FIG. 4.
Specific binding of ESU-IgG to human Hyal2 expressed on 208F and NIH 3T3 cells. (A) Parental or human Hyal2-expressing 208F or NIH 3T3 cells were incubated with various concentrations of ESU-IgG, were incubated with secondary antibody, and were analyzed by FACS. At each ESU-IgG concentration, the geometric mean fluorescence of parental cells (208F or NIH 3T3) was subtracted from that of human Hyal2-expressing cells (208F/Hyal2 or NIH 3T3/Hyal2) to obtain the human Hyal2-specific binding values, in arbitrary units, and these values are plotted against the ESU-IgG concentration. All results were generated using the same reagents and the same FACS settings and were repeated once, with similar results. (B) Scatchard analysis of the data from panel A is shown. Best-fit lines, their equations, and the Pearson correlation coefficients are indicated. Kd values (micromolars) are equal to −1/slope.

