
Fig. 9.
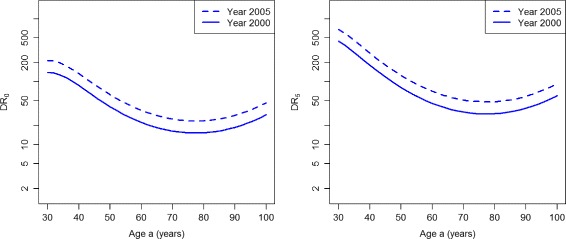
Detection ratios in the improved case-finding scenario. Age-specific detection ratios DR0 (left) and DR5 (right) in the years t=2000 (solid lines) and t=2005 (dashed lines) in the scenario PU−
Official websites use .gov
A
.gov website belongs to an official
government organization in the United States.
Secure .gov websites use HTTPS
A lock (
) or https:// means you've safely
connected to the .gov website. Share sensitive
information only on official, secure websites.
Detection ratios in the improved case-finding scenario. Age-specific detection ratios DR0 (left) and DR5 (right) in the years t=2000 (solid lines) and t=2005 (dashed lines) in the scenario PU−