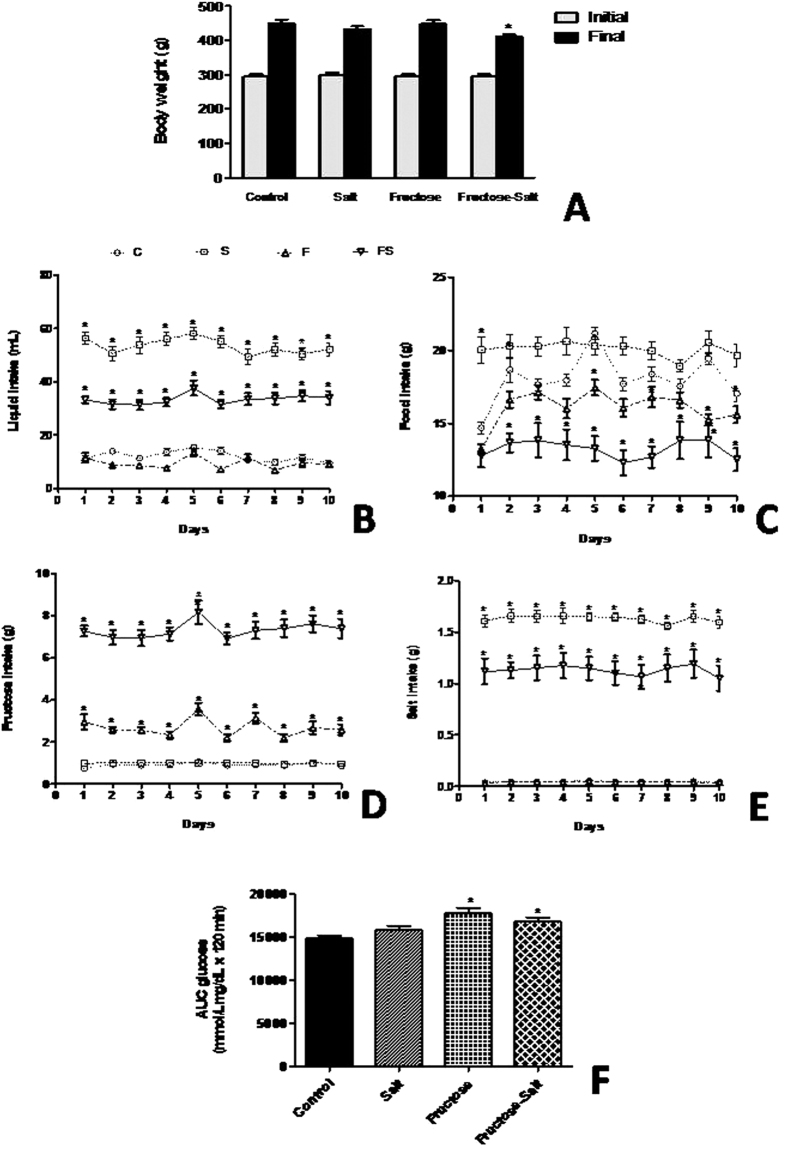
Figure 1. Characteristic of fructose-fed rats on high-salt diet.
Change in body weight (A), liquid intake (B) food intake (C), fructose intake (D), salt intake (E), and glucose AUC (F). Data are presented as means ± SEM. *P < 0.05 compared with control group. n = 10–12 in each group. C, control group; S, high-salt group; F, high fructose group; FS high fructose and high salt after a previous 10 weeks treatment with F.

