
Figure 7. Generation of ROS and expression of NFκB p65 in HEK293 cells treated with fructose, salt, and Tempol for 4 h.
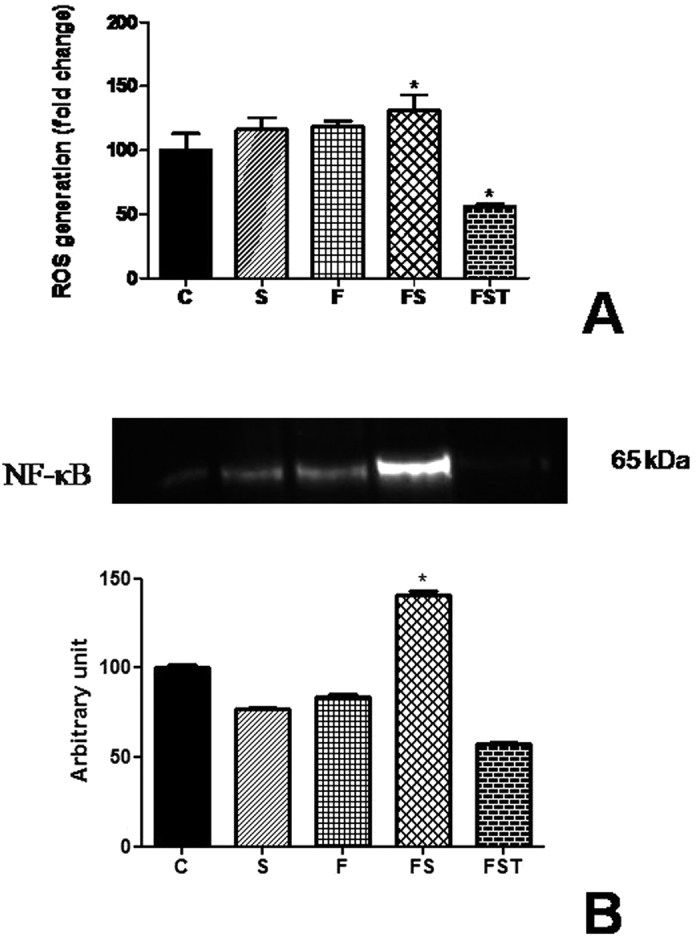
Reactive oxygen species production (A) and NFκB p65 protein expression (B). ROS were quantified by the H2-DCFDA assay. All results are expressed relative to the levels found in control cells, arbitrarily set at a value of 100%. Panel shows bands of NFκB p65 analyzed using Western blotting and quantitative results of detected proteins determined by densitometric analysis. *P < 0.05 compared with control group. n = 3 in each group. ROS, reactive oxygen species; C, control group; CT, control group + Tempol; FS, high fructose and salt group; FST, high fructose and salt group + Tempol.