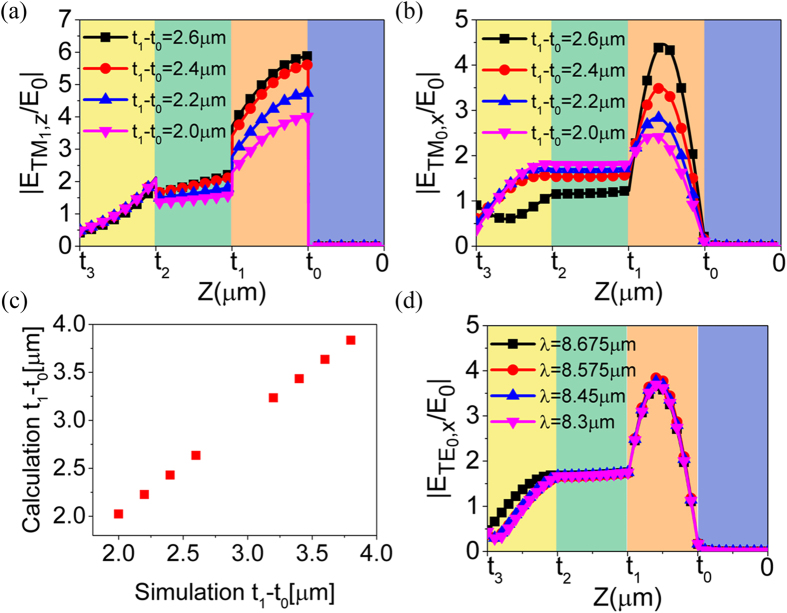
Figure 5. Modes analysis of the coupling between SPPs and standing wave.
(a) and (b) Distribution of  and
and  amplitudes at the positions of (2.0 μm, 8.3 μm), (2.2 μm, 8.45 μm), (2.4 μm, 8.575 μm) and (2.6 μm, 8.675 μm) in Fig. 2(b), respectively. (c) Comparison of the simulated and calculated thickness of the dielectric layer. (d) Distribution of
  amplitudes at the positions of (2.3 μm, 8.3 μm), (2.35 μm, 8.45 μm), (2.4 μm, 8.575 μm) and (2.45 μm, 8.675 μm) in Fig. 2(a).

