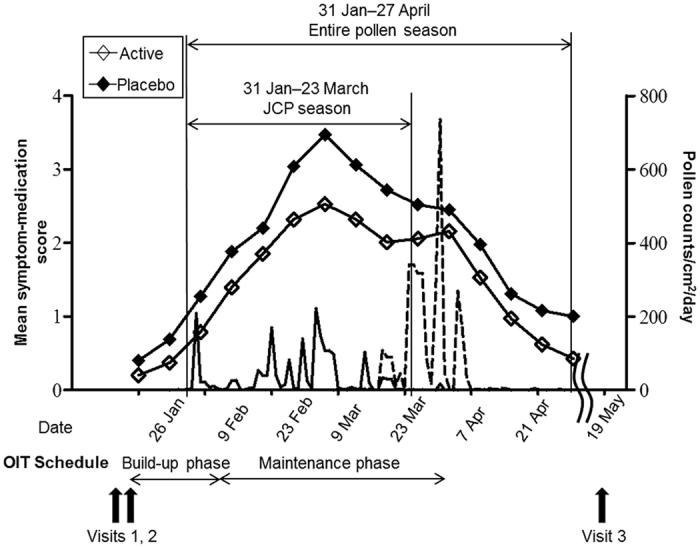
Figure 2. Study design, symptom-medication score and daily Japanese cedar/cypress pollen counts.

Solid line: Japanese cedar pollen counts. Broken line: Japanese cypress pollen counts. Open squares: symptom-medication score in the active group (n = 26). Solid squares: symptom-medication score in the placebo group (n = 28). Statistical analysis was performed using unpaired t-test between active and placebo groups. Visit 1: early January 2014, screening of potentially eligible subjects. Visit 2: mid-January 2014, the beginning of the build-up phase of OIT after randomization. Visit 3: middle of May 2014, after the entire pollen season.
