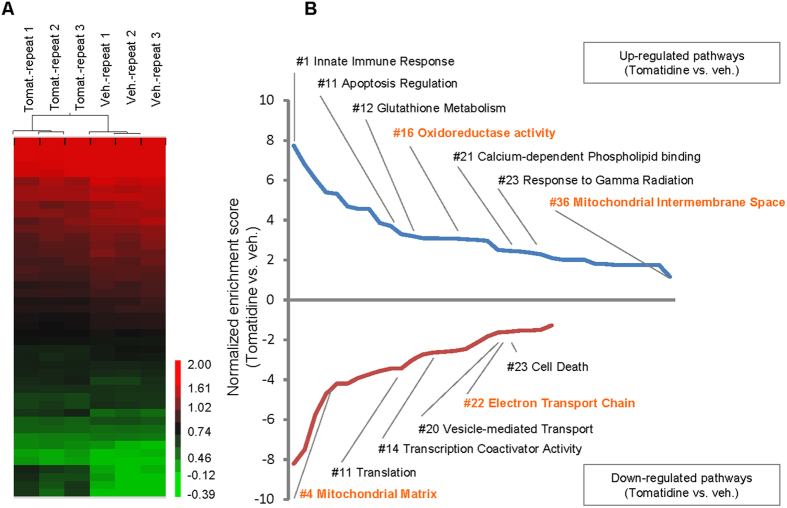
Figure 2. Effects of tomatidine on the transcriptome of C. elegans.
(A) Heatmap of microarray data showing genes that were differentially expressed in control and tomatidine-treated nematodes. (B) A list of significantly changed GO signaling pathways in tomatidine-treated worms compared with vehicle-treated changes. Mitochondria-related pathways are marked orange. See Table S2 for a complete gene list.

