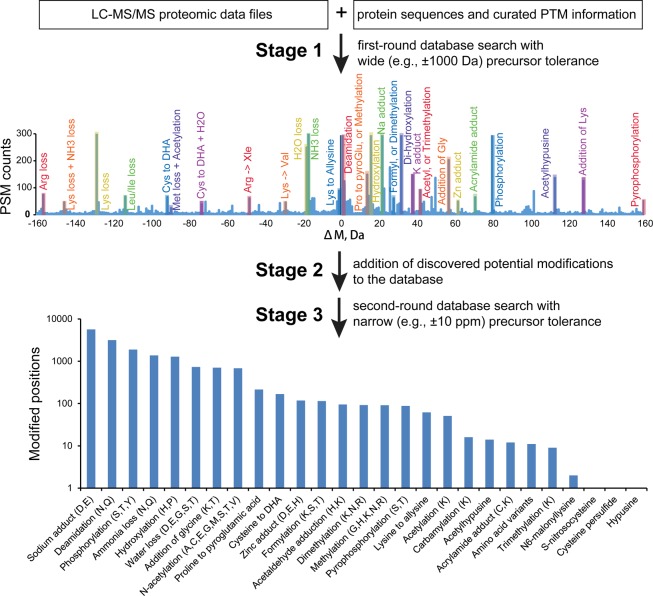
Figure 1.
G-PTM-D workflow, illustrated with results from the Jurkat cell data set. An expanded view (±160 Da) of the histogram of precursor mass error (ΔM) searched with ±1000 Da precursor mass tolerance is displayed here; the full histogram and a comparison to a ±200 Da search are shown in Supplementary Figure S1. The numbers of modified sites for each of the 27 identified modification types are also displayed.

