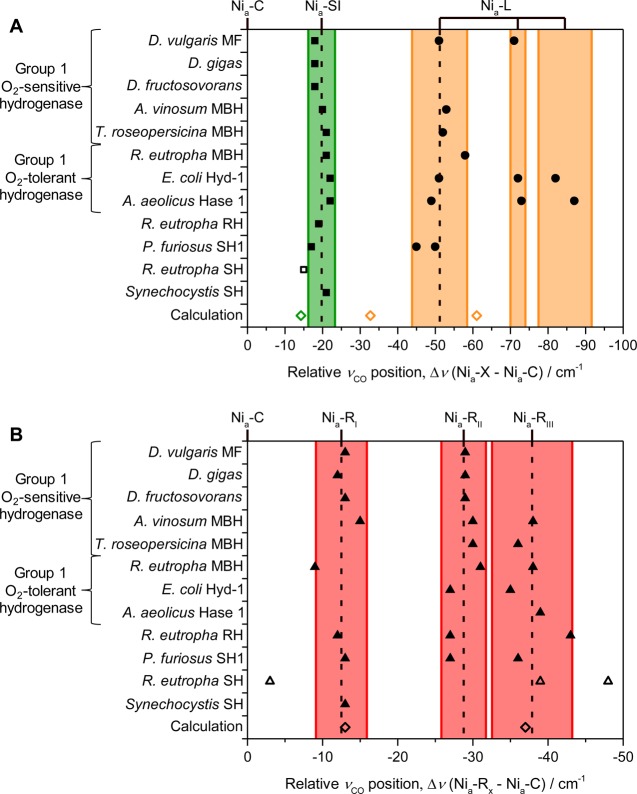
Figure 10.
Relative νCO positions of catalytically active states of [NiFe] hydrogenases show remarkably similar wavenumber positions with respect to the Nia-C state. (A) Relative positions of the Nia-SI and Nia-L states, showing that the Nia-L states fall into three groupings of νCO. (B) Relative positions of the Nia-R states demonstrates three νCO groupings. Calculated using the data in Table 1. Shaded regions represent ±2 standard deviations of the mean relative νCO position for each state (νCO values for R. eutropha SH have been omitted from these calculations as they are less well-characterized but are plotted for comparison; open squares/triangles). Included for comparison are results from DFT calculations of the Nia-SI,91 Nia-L,53 and Nia-R91 states (open diamonds).

