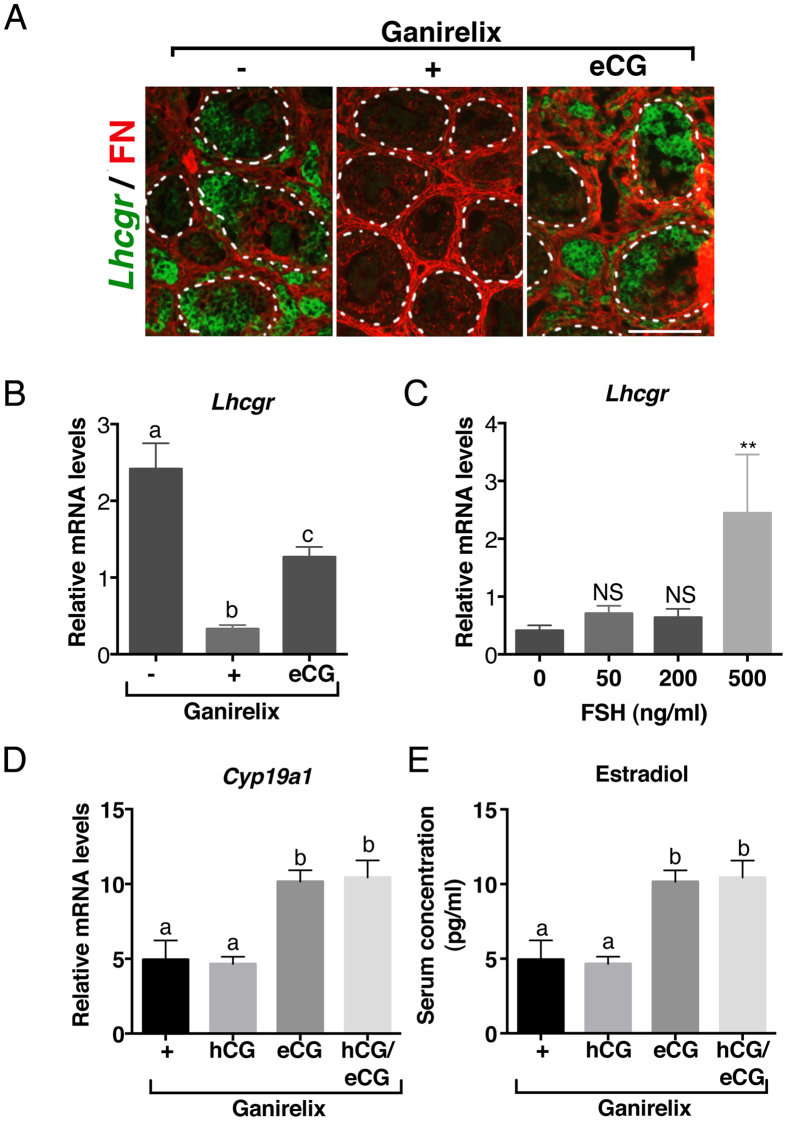
Figure 4. The elevated FSH levels of the infantile period stimulate the expression of LHCGR but probably not the activation of LHCGR signaling in granulosa cells.
(A) Merged images of in situ hybridization assay detecting Lhcgr mRNAs (purple color digitally converted into green color) with immunolabelled fibronectin (FN, red) in preantral/early antral follicles of females treated with saline (−), Ganirelix (+) or Ganirelix plus eCG (eCG). (B) Relative intra-ovarian contents of Lhcgr mRNAs in the ovaries of females treated with saline (−), Ganirelix (+) or Ganirelix plus eCG (eCG) (8–9 ovaries/group). (C) Relative intra-ovarian contents of Lhcgr mRNAs in cultured postnatal ovaries (3–10 ovaries/group) in response to different concentrations of purified FSH. (D) Relative intra-ovarian contents of Cyp19a1 mRNAs in the ovaries of females treated with Ganirelix (+), Ganirelix plus hCG (hCG), Ganirelix plus eCG (eCG), or Ganirelix plus hCG and eCG (hCG/eCG) (7–9 ovaries/group). (E) Circulating E2 levels in 5–6 pooled serum in females treated with Ganirelix (+), Ganirelix plus hCG (hCG), Ganirelix plus eCG (eCG), or Ganirelix plus hCG and eCG (hCG/eCG), as determined by GC-MS. Data in B, D and E were analyzed by one-way ANOVA, with distinct letters indicating significant differences between groups. Data in C were analyzed by Student t-test with **P < 0.01 in treated samples versus control group. Scale bars: 100 μm.

