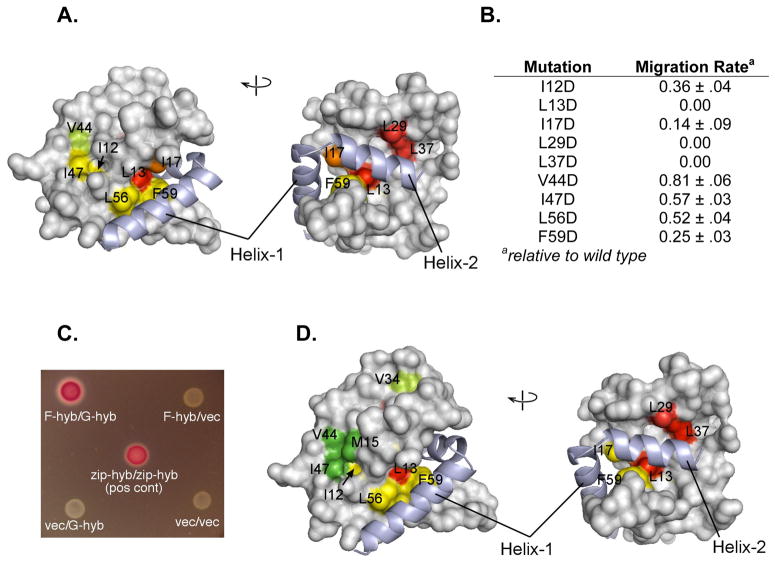
Figure 6.
In vivo E. coli motility and interaction assays. (A) Two views of the FliGN domain, showing motility defects that result upon replacement of the indicated hydrophobic residues with aspartate. Motility phenotypes were tested by expressing mutant FliG proteins in the fliG null strain. Yellow-green, rate less than 100% but greater than 70% of wild-type; yellow, rate between 20% and 70% of wild type; orange, motile but at less than 20% of wild type; red, immotile. (B) A table summarizing the relative rates, values are the mean ± s.d. for 3 determinations. (C) Interaction between FliFC (residues 505–552) and FliGN (residues 1–87) observed in the bacterial adenylate cyclase two-hybrid system. Positive interactions drive expression of β-galactosidase. Negative controls and a leucine-zipper positive control are shown. (D) Effects of hydrophobic-to-aspartate replacements in FliGN on the FliF-FliG interaction. Coloring is based on β-galactosidase activities: Green, activity indistinguishable from wild type; yellow-green, activity less than 100% but greater than 70% of wild type; yellow, activity between 20% and 70% of wild type; red, activity decreased to the level of negative controls. FliFC shown light purple in all figures. See also SI Figure 8.

