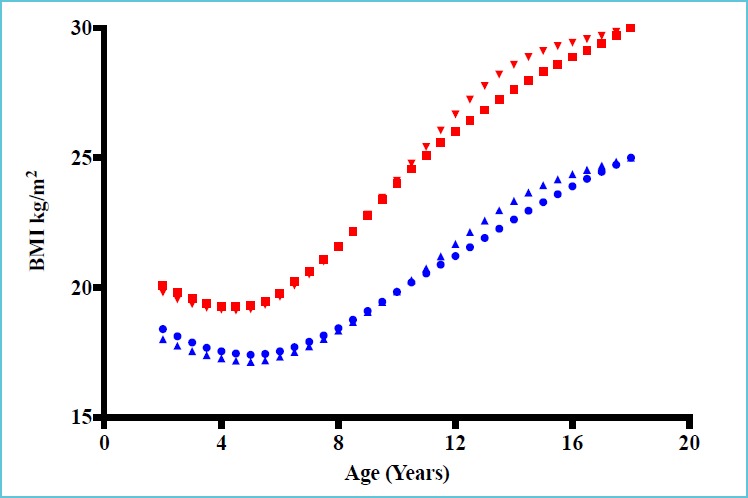
Figure 1.
International age- and sex-specific cut-off points for BMI for overweight and obesity

*Adapted with permission from data of Table 4 from Cole TJ et al. (16). Data obtained by averaging the national centiles.
BMI: Body Mass Index. Filled circles: curve for overweight boys; filled square: curve for obese boys; filled upward triangles: curve for overweight girls; filled downward triangles: curve for obese girls.
