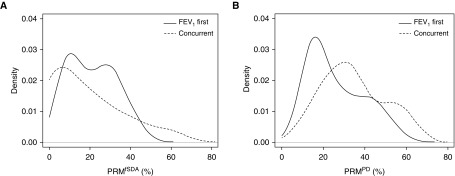
Figure 5.
Distribution of parametric response mapping (PRM) of functional small airways disease (PRMfSAD) (A) and PRM of parenchymal disease (PRMPD) (B) at the time of spirometric decline stratified by FEV1 First (presenting with isolated decline in FEV1) and Concurrent (presenting with simultaneous decline in both FEV1 and FVC) (n = 13) group status.

