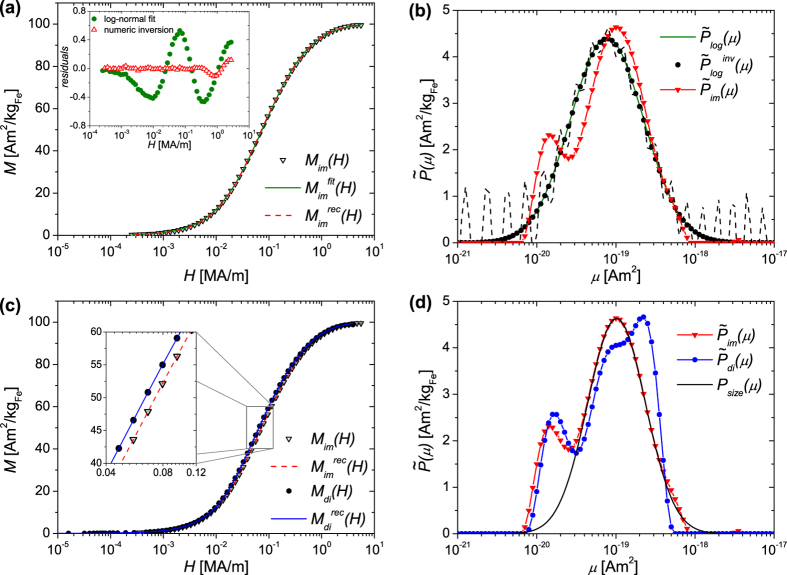
Figure 5. Magnetic characterisation of the multi-core particles at T = 300 K.
(a) Initial magnetisation curve of Mim(H) from Fig. 4, fit  with equation 6 under assumption of a log-normal distribution pV(μ) and reconstructed data set
  (numerical inversion). Inset: Residuals of the log-normal fit and of the numerical inversion. (b) Log-normal distribution of magnetic moments
  determined by fitting Mim(H) with equation 6. The fitting curve
  with artificially added noise was numerically inversed, resulting in the distribution
  (dashed line shows the extracted distribution in case of a reduced regularisation parameter). With the same numerical approach the distribution
  was extracted from the experimental data Mim(H). (c) Initial magnetisation curves of Mdi(H) and Mim(H) from Fig. 4 and the reconstructed data sets
  and
and  . For the reconstruction the moment distributions
  and
and  from Fig. 5(d) were used. (d) Discrete moment distributions
  (from Fig. 5(b)) and
  determined by numerical inversion of the initial magnetisation curves of Mim(H) and Mdi(H). The distribution Psize(μ) was calculated for a particle ensemble with a mean core size from a log-normal distribution of 6.6 nm (σ = 0.28).

