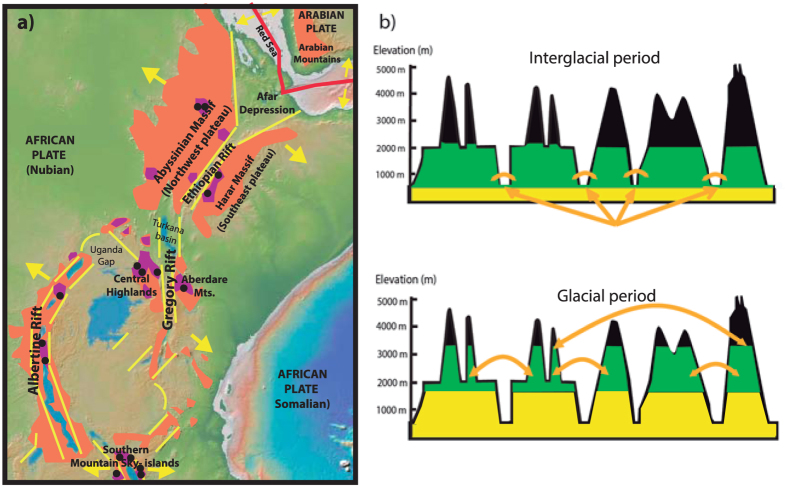
Figure 1. Geographic map of the Afromontane forests and main phylogeographic hypotheses.
(a) Geographic map of Eastern Africa showing the main geographic features named in the text. The Eastern Afromontane biodiversity hotspot is shaded in orange. The distribution of Canarina eminii is shaded in purple. The Rift System is shown in yellow; lines represent major tectonic faults and arrows indicate the direction of relative divergent Rift movement. The red line shows the tectonic plate boundaries. The map was generated using the software GeoMapApp (v. 2.3) (http://www.geomapapp.org/)85. Black dots represent the sampling for C. eminii. (b) Sky-islands housing Afromontane forests (in green) separated by savannahs and open forests (in yellow), showing the two main phylogeographic hypotheses postulated to explain patterns of genetic variation in Afromontane organisms. Upper) the “mountain forest bridge” hypothesis (arrows indicate forest reconnections); Lower) the “long-distance dispersal” hypothesis (arrows indicate migration events).

