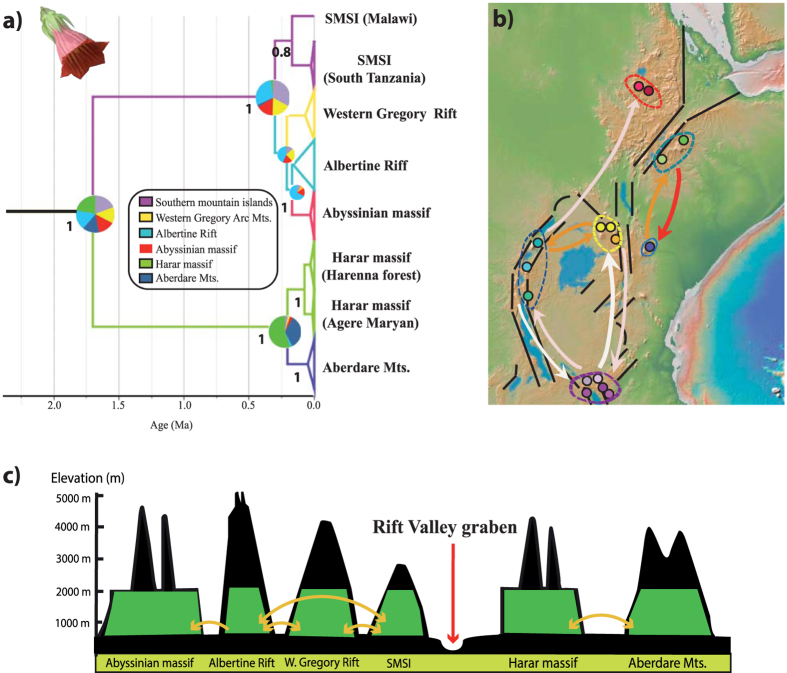
Figure 4. Phylogeographic analysis and reconstruction of the colonization of Canarina eminii.
(a) BEAST MCC tree showing the Bayesian ancestral range reconstruction analysis63. Coloured branches (see legend) represent the ancestral range with the highest posterior probability for each population; node pie charts show marginal probabilities for alternative ancestral ranges. Numbers below branches represent Bayesian posterior probabilities. (b) Map representing migration events that receive a BF support > 3, as recovered by BSSVS; colour tint is proportional to the support (dark red > orange > pale pink > white). The map was generated using the software GeoMapApp (v. 2.3) (http://www.geomapapp.org/)85 (c) A hypothetical reconstruction of the colonization of the Afromontane forest by Canarina eminii during interglacial periods based on our data and literature of other Afromontane groups. Orange arrows show possible short to medium distance dispersal events between isolated mountain ranges or across forest galleries. Expansion of the Afromontane forest (in green) during interglacial periods may have facilitated migration across Stepping Stone dispersal or forest bridges.

