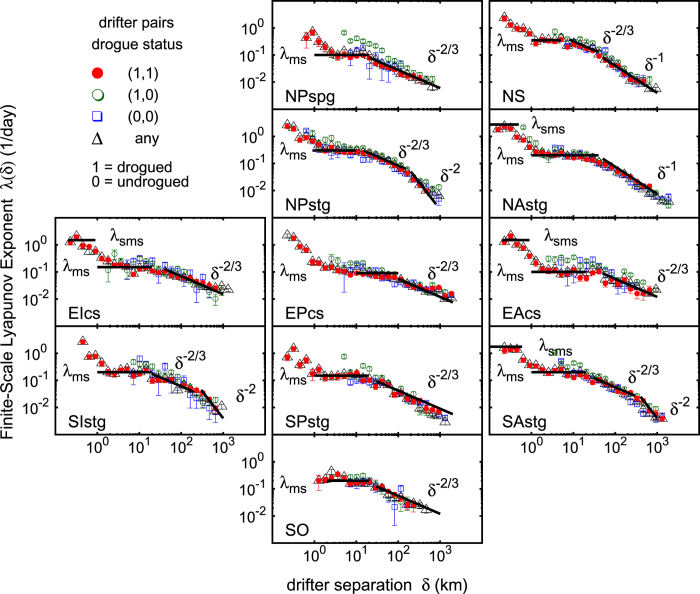
Figure 2. FSLE computed on the Global Drifter Program data set subdivided in eleven ocean basins (see Fig. 1).
Colors are associated to the drogue status of the SVP drifter pairs: red = drogued (1,1); green = drogued/undrogued (1,0); blue = undrogued (0,0); black = any status. The FSLE scaling exponent, λ(δ) ~ δ−β, corresponds to: Richardson’s dispersion (β = 2/3), shear/ballistic separation (β = 1), and standard eddy-diffusion (β = 2). Exponential separation rates, i.e. λ(δ) ≃ constant, are indicated as λms, for the mesoscales, and as λsms, for the submesoscales (when resolved). Maximum initial separation allowed: Δ = 10 km. Amplification ratio  . The FSLE λ(δ) is inversely proportional to the characteristic time scale of dispersion at scale δ. Panel generated with GNUPLOT 5.0 (Williams, T. and Kelley, C., 2011; Gnuplot 5.0: an interactive plotting program; URL: http://gnuplot.info).

