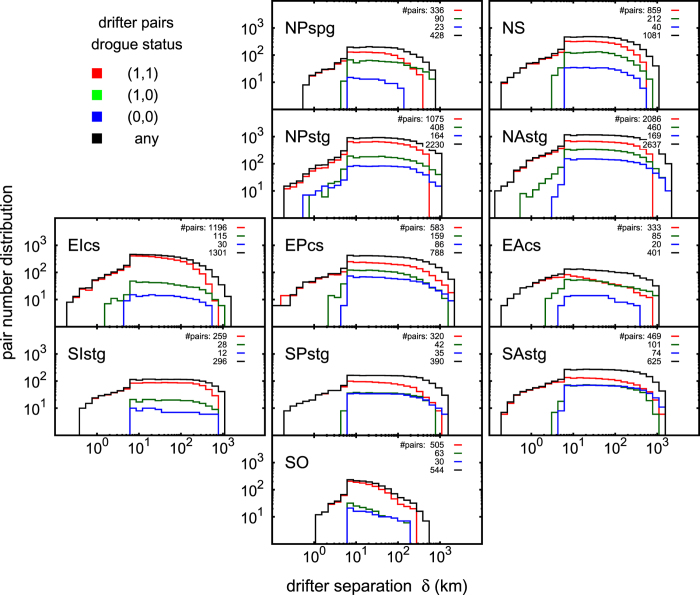
Figure 3. Drifter pair statistics of the FSLE analysis.
Colors are associated to the drogue status of the drifter pairs. The numbers plotted on the top right corner of each panel are the total number of pairs analyzed for each drogue status: drogued (1,1); drogued/undrogued (1,0); undrogued (0,0); any status. The statistics is also determined by the filter imposed to the maximum allowed initial separation of the drifters (Δ = 10 km). Panel generated with GNUPLOT 5.0 (Williams, T. and Kelley, C., 2011; Gnuplot 5.0: an interactive plotting program; URL: http://gnuplot.info).

