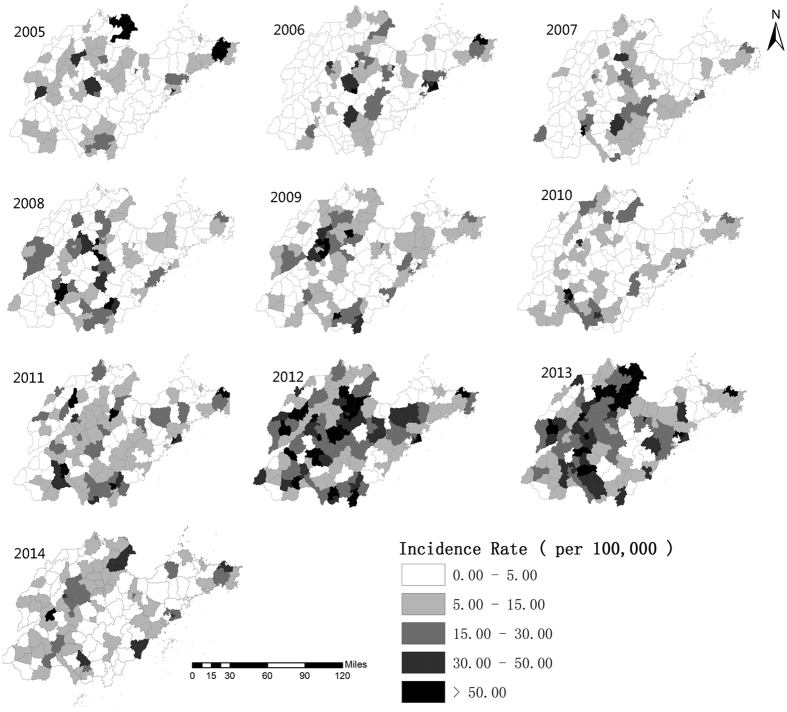
Figure 2. Geographical distribution of the incidence rates of mumps in Shandong Province, China at the county level from 2005–2014.
The incidence rates of mumps are colored with different colors in the map using the software ArcGIS10.2 (https://www.arcgis.com/features/index.html, ESRI, Inc., Redlands, CA, USA).

