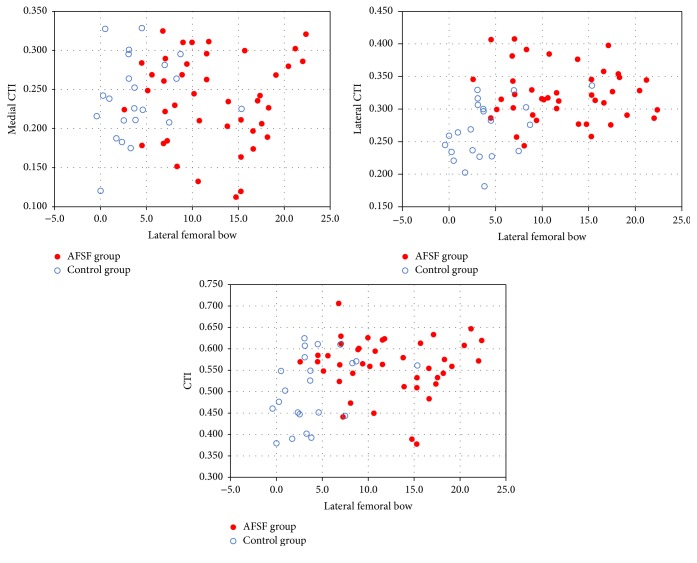
Figure 3.
Correlation of medial, lateral, and total CTIs with lateral femoral bow in AFSF group (red filled dot) and control group (blue open rings). The scatter plot shows significant correlation between lateral and total CTI, with lateral femoral bow (R = 0.378, P = 0.002; R = 0.268, P = 0.032, resp.). There was no correlation found between medial CTI and lateral femoral bow (R = 0.027, P = 0.835).

