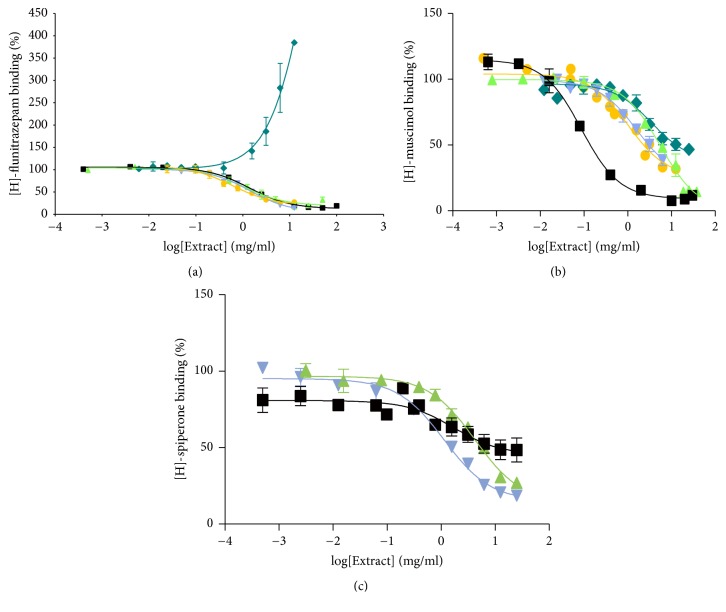
Figure 7.
Effects on ligand binding to membrane neuroreceptors. Effects of extracts of BYPA (■, black); B (▲, green); Y (▼, light blue); P (♦, dark blue); and A (●, yellow). (a) Binding of [3H]-flunitrazepam yielding IC50 values of 1.37 ± 0.05 mg/ml, 1.05 ± 0.10 mg/ml, 1.41 ± 0.06 mg/ml, and 0.60 ± 0.12 mg/ml for BYPA, B, Y, and A, respectively, and EC50 of 4.01 ± 0.39 mg/ml for P. (b) Binding of [3H]-muscimol yielding IC50 values of 0.09 ± 0.06 mg/ml, 5.50 ± 0.08 mg/ml, 1.57 ± 0.12 mg/ml, 3.49 ± 0.14 mg/ml, and 1.02 ± 0.07 mg/ml, respectively, for BYPA, B, Y, P, and A and (c) binding of [3H]-spiperone yielding IC50 values of 1.71 ± 0.25 mg/ml, 4.26 ± 0.09 mg/ml, and 1.14 ± 0.07 mg/ml for BYPA, B, and Y, with little inhibition by P or A. Data represent mean ± SEM. Total [3H]-ligand binding recorded in each of panels (a)–(c) represented the sum of specific and nonspecific bindings (see Section 2.13), with specific binding constituting more than 90%, 75%, and 60% of total binding, respectively.

