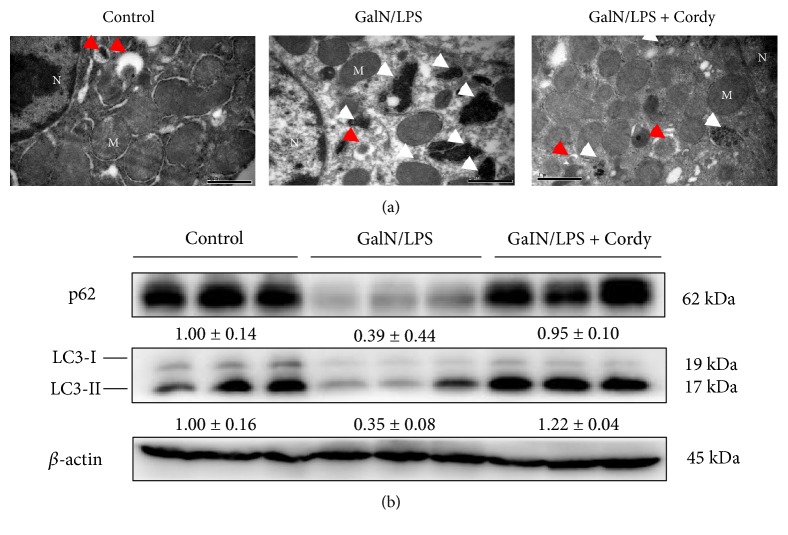
Figure 5.
Cordycepin blocks excessive autophagy. Murine liver tissues were collected at 5 h after injected with GalN (700 mg/kg)/LPS (15 μg/kg). (a) Electron microscope analysis of liver tissues. Red arrows denote autophagosomes. White arrows denote autolysosomes. N: nucleus; M: mitochondria. Bars: 1 μm. (b) Immunoblot analysis of LC3 and p62 protein expressions (n = 5). Each value is mean ± SEM.

