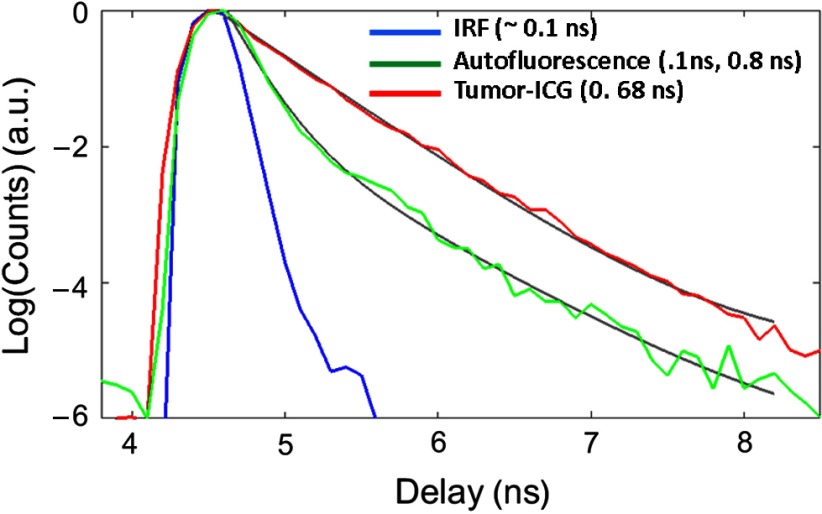
Fig. 1.
Representative TD instrument response function (blue), AF signal from normal tissue (green), and fluorescence from a subcutaneous U87 glioma tumor (red) in a live mouse 24 h after tail vein injection of ICG. While the tumor fluorescence can be fit using a single exponential, the AF is ideally described as a biexponential decay (solid gray lines). For the analysis in this paper, the decay portion of the signal is fit using a simple exponential decay [] to obtain the lifetimes at each pixel location [Figs. 2(g)–2(i)].

