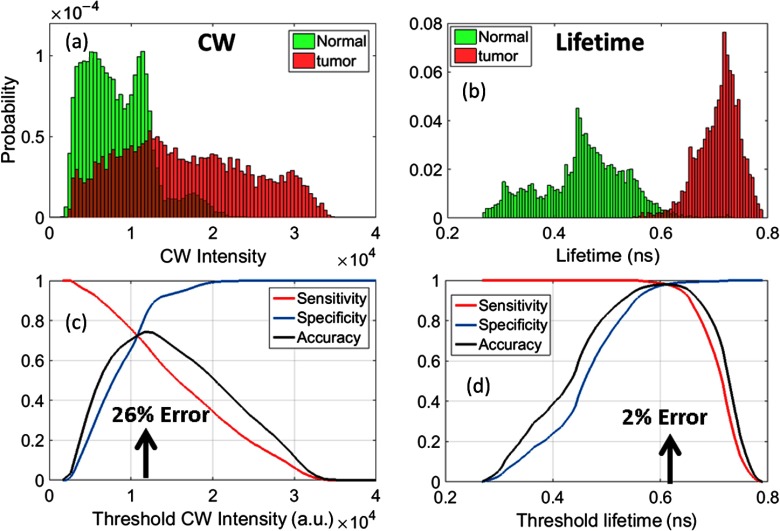
Fig. 3.
Normalized distribution of (a) CW intensity and (b) FLT in the tumor (red) and normal tissue (green) for the U87 glioma tumor data in Figs. 2(d) and 2(g). Sensitivity, specificity, and accuracy of thresholding using (c) CW Intensity and (d) FLT. Sensitivity is calculated as the total number of pixels within the tumor area with intensity or lifetime above the threshold/total number of pixels within the tumor. Specificity is the total number of pixels outside the tumor area below the threshold intensity or lifetime/total number of pixels outside the tumor. Accuracy was calculated as follows: . Arrows indicate points of highest accuracy/least error.

