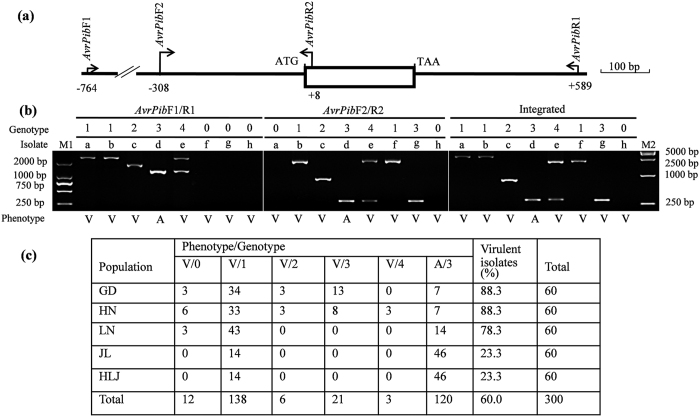
Figure 2. Allelic variation for AvrPib.
(a) The two primer pairs AvrPibF1/R1 and AvrPibF2/R2 detect the presence of the Pot2 and Pot3 transposons in the 5’ region of the gene. The CDS is represented by open box. (b) Typing of eight Mo isolates. The AvrPibF1/R1 and AvrPibF2/R2 amplicons were used to distinguish five alleles: 0 (no amplification), 1–3 (one fragment of variable size) and 4 (two fragments); the disease reaction of each isolate when inoculated on IRBLb-B was either A (avirulent) or V (virulent). The different genotypes assigned in a given isolate were integrated by positive ones. The phenotype/genotype is given to each isolate as: a, CHL2600 (V/1), b, CHL2626 (V/1), c, EHL0348 (V/2), d, CHL2345 (A/3), e, EHL0342 V/4), f, CHL2549 (V/1), g, CHL2417 (V/3), h, EHL0370 (V/0); M1, M2: size markers. (c) Allelic variation among the five Mo populations collected in Guangdong (GD) and Hunan (HN) in South, and Liaoning (LN), Jilin (JL), and Heilongjiang (HLJ) in Northeast China (also see Supplementary Table S2).

