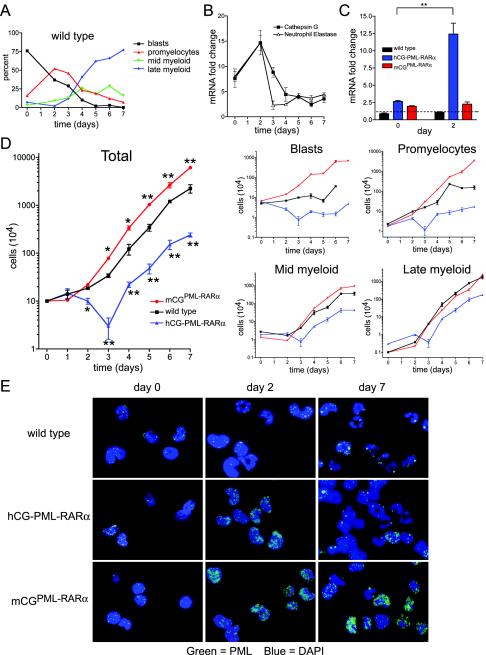
FIG. 2.
In vitro granulocytic differentiation of myeloid progenitors from two murine models of APL. (A) Manual myeloid differential counts from wild-type cultures over 7 days. Black, myeloblasts and undifferentiated progenitors; red, promyelocytes; green, myelocytes and metamyelocytes; blue, bands and mature neutrophils. (B) Real-time qRT-PCR on wild-type cells for the primary granule proteases cathepsin G and neutrophil elastase. Data are expressed as mean mRNA fold change for each gene relative to GAPDH mRNA abundance and standard deviation, each performed in triplicate. (C) Real-time qRT-PCR on cells from wild-type, hCG-PML-RARα, and mCGPML-RARα cells at days 0 and 2 of culture. Data are expressed as in panel B. The dotted line represents the maximum background signal from wild-type cultures. Significance was calculated by Student's t test (**, P < 0.01). (D) (Left) Mean cell numbers and standard deviations over time in culture; data represent those for one of three independent experiments, each plated in duplicate (*, P < 0.05; **, = P < 0.01 [for hCG-PML-RARα or mCGPML-RARα versus wild-type cultures]). (Right) Manual differentials were scored on each day in culture by counting 100 May-Grunwald-Giemsa-stained cells. Absolute numbers of the indicated myeloid subsets were calculated by multiplying the fraction of each by the total number of cells. (E) Immunofluorescence microscopy with an antibody recognizing mouse PML.

