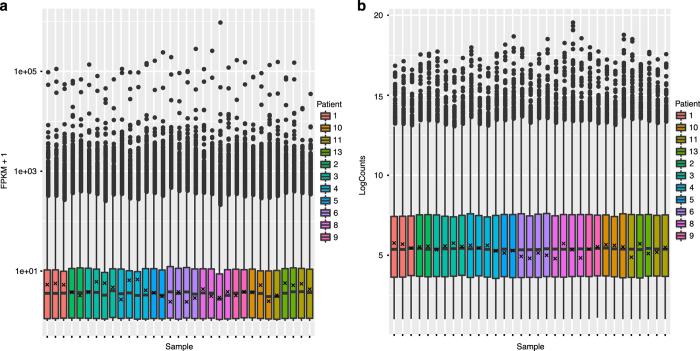
Figure 4. RNA-Seq count distribution.
Distribution of RNA-Seq read counts per gene for both (a) DESeq normalized per-gene counts and (b) FPKM calculated by Cufflinks. Reads are distributed similarly across samples after filtering for unexpressed genes (<2 counts or FPKM of 0.1). Expression of NF1 is indicated by ‘x’ in each sample.

