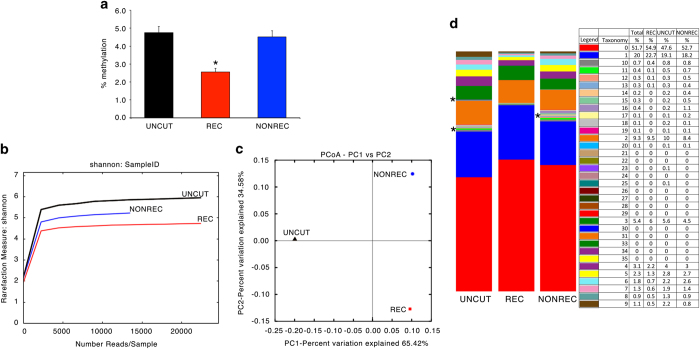
Figure 2. Qualitative DNA methylation profiles in recombinant and non-recombinant GFP molecules.
(a) Quantitative methylation analysis of GFP molecules derived from the samples indicated in Fig. 1. In all, 41 CpGs are present in the fragment analysed and are located in the cassette I. The sequence of the cassette I in control or NONREC molecules has been transformed into the recombinant version to compare identical primary sequences. Data were expressed as the mean±s.e.m. (n=41); *P<0.01 (paired t-test) comparing REC versus UNCUT or versus NONREC. (b) Shannon diversity index between REC (red) and NONREC (blue) and control UNCUT (black). (c) Principal component analysis of REC (red) and NONREC (blue) and control UNCUT (black). (d) Methylation content (taxonomy) of REC and NONREC and control UNCUT.

