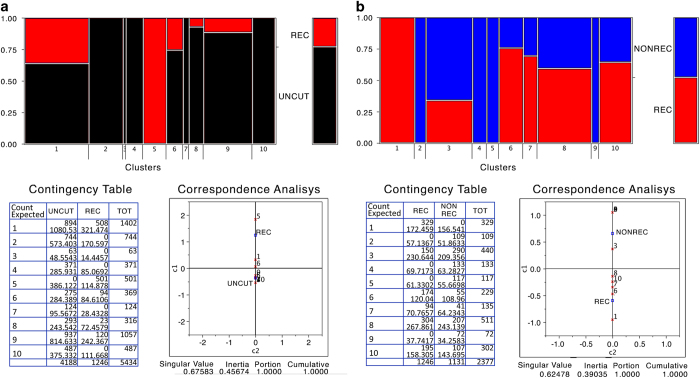
Figure 3. Epiallelic species present in control (UNCUT), recombinant and non- recombinant cells.
Cluster analysis of the entire collection of GFP sequences. (a) Red and black represent the fraction of molecules present in REC (red) or control UNCUT (black) cells. The panel below on the left represents the actual number of sequences in each cluster. The panel on the right shows the Euclidean distance between the various clusters. (b) Red and blue represent the fraction of molecules present in REC (red) or NONREC cells repaired mainly by NHEJ (blue). The panel below on the left represents the actual number of sequences in each cluster. The panel on the right shows the Euclidean distance between the various clusters.

